

BarrioMap is a free, open-source tool that turns OpenStreetMap data into a map. You can print the resulting map, can hold, annotate, and bring to a meeting. This post presents a quick tour of how to use BarrioMap.
Step 1: Open it
Go to datadiversitylab.github.io/barriomap.
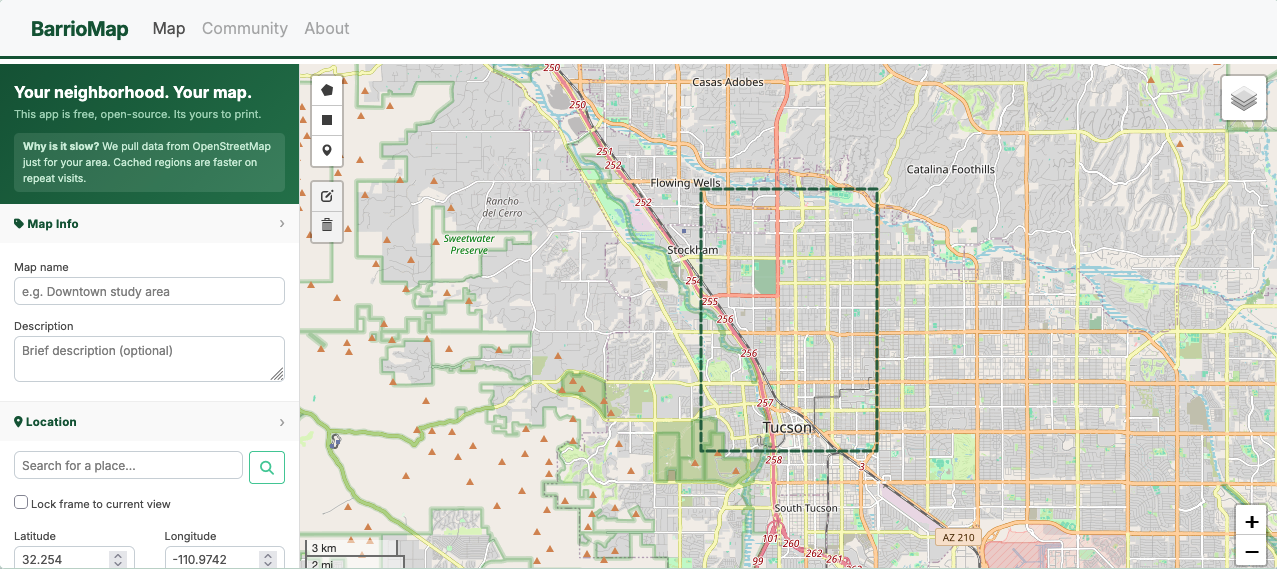
The map opens right away, centered on Tucson, AZ. You will see a sidebar on the left and the interactive map on the right. That green dashed rectangle on the map? That is your future printout. Everything inside it is what will end up on your PDF.
Step 2: Name your map
At the top of the sidebar, there is a small section called Map Info. Give your map a name. Something like "Our block" or "Park near school." This name shows up on the cover page of your PDF, so you will know what it is later.
You can also add a short description if you want. This is optional.
Step 3: Find your place
In the Location section, type a neighborhood, a street, or a city in the search box. Hit Enter or click the magnifying glass. The map should move there automatically.
You can also type coordinates directly if you know them. And if you want the map to stay exactly where it is while you change other settings, check Lock frame to current view. This is useful once you have found the right spot.
Step 4: Choose your page and scale
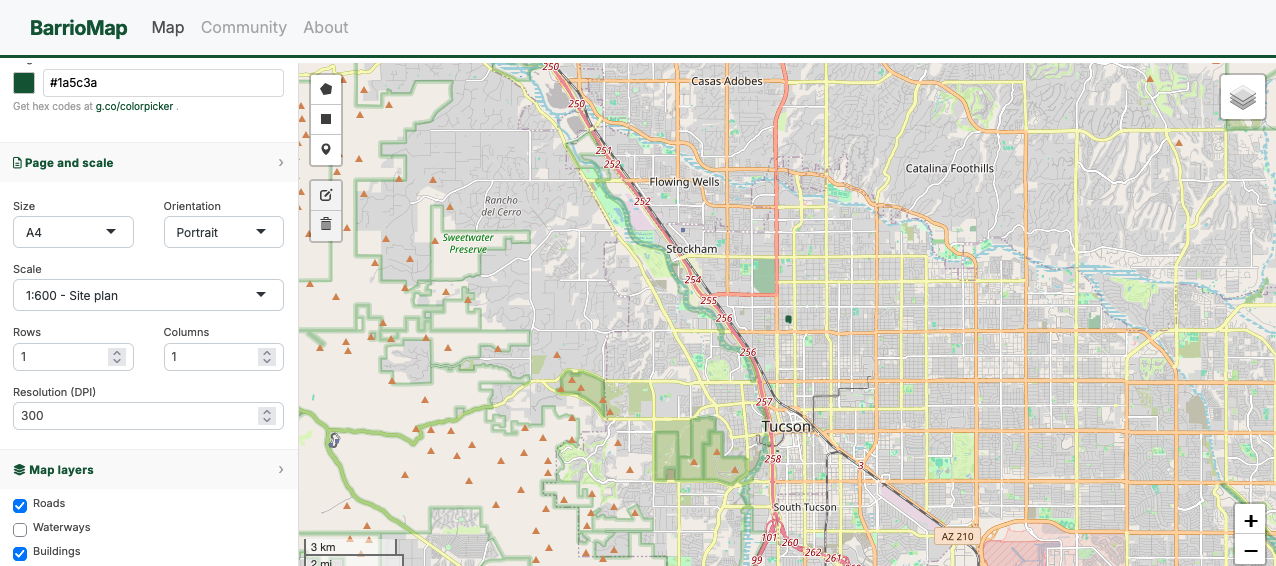
In the Page & Scale section, pick your paper size. A4 works for most home printers. A3 gives you more room if you have access to a larger printer.
Then pick a scale. The scale controls how much ground fits on your page.
- 1:5,840 shows a neighborhood overview. About a one-mile area fits on an A4 sheet.
- 1:600 is a site plan. Good for a single block or a school campus.
- 1:384 is a design detail. Use this for a specific building or corner.
The green rectangle on the map updates as you change the scale, so you can see exactly what area you are covering.
Step 5: Pick your layers
In Map Layers, check the boxes for what you want to see on your map. Roads and buildings are on by default. You can also add parks, water bodies, transit stops, schools, healthcare facilities, and more.
Under Print Settings, you can change the color of any layer. Click the color box next to a layer and type a hex code, or visit g.co/colorpicker to pick one visually.
Step 6: Add your own data (optional)
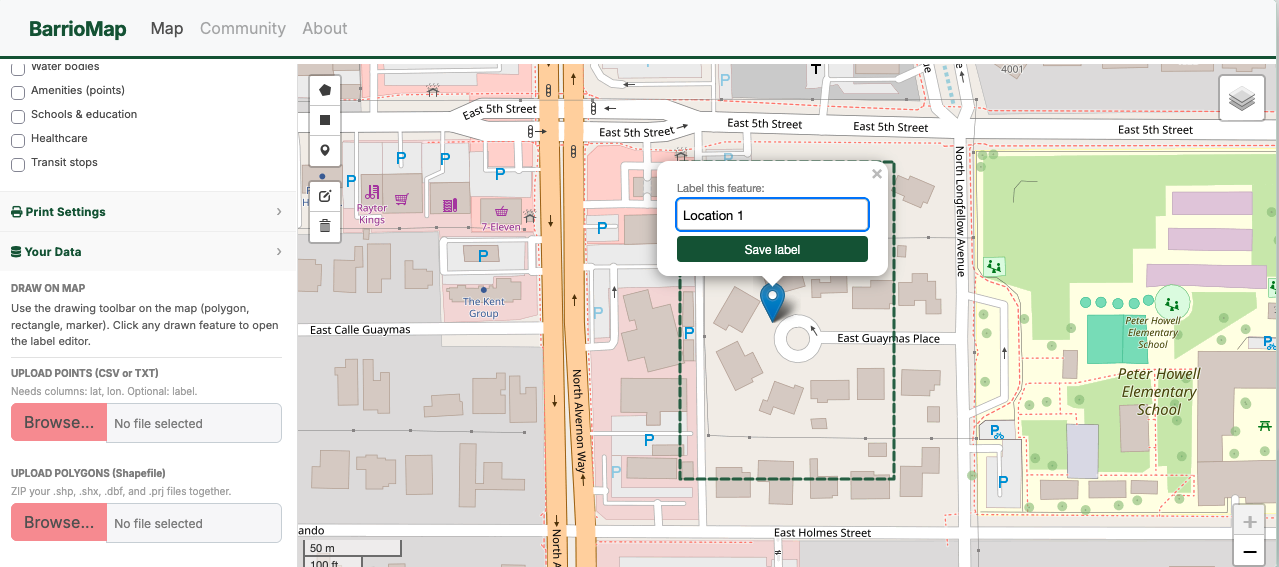
In the Your Data section, you can draw directly on the map. Use the toolbar that appears on the map itself — you will see icons for drawing a polygon, a rectangle, or a point. Click a shape you drew to add a label to it.
You can also upload data:
- A CSV file with latitude and longitude columns for points (where are the broken streetlights? where does flooding happen?)
- A shapefile (zipped) for polygons
- A GeoTIFF for raster images like satellite data
Anything you add can also be printed on your PDF. Check the boxes in Print Settings to include or exclude each type.
Step 7: Generate your map
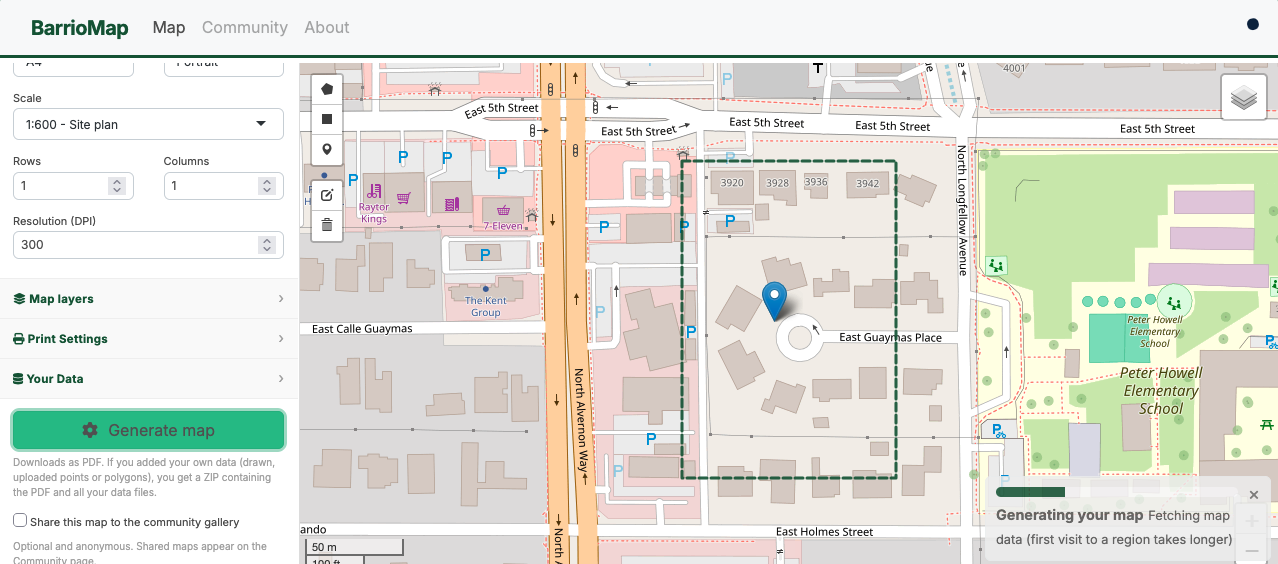
When you are ready, click Generate map. The app starts building your PDF on the server. You will see a progress bar.
This takes a minute, especially the first time. That is because the app is downloading fresh data from OpenStreetMap just for your area. Once the data is cached, future exports for the same region are expected to be much faster.
Step 8: Download
When the map is ready, a Download button appears below the Generate button. Click it to save your file.
If you did not add any data of your own, you get a PDF. If you drew or uploaded data, you get a ZIP file containing the PDF and GeoJSON files of your data. Those GeoJSON files open in QGIS, ArcGIS, or any GIS tool.
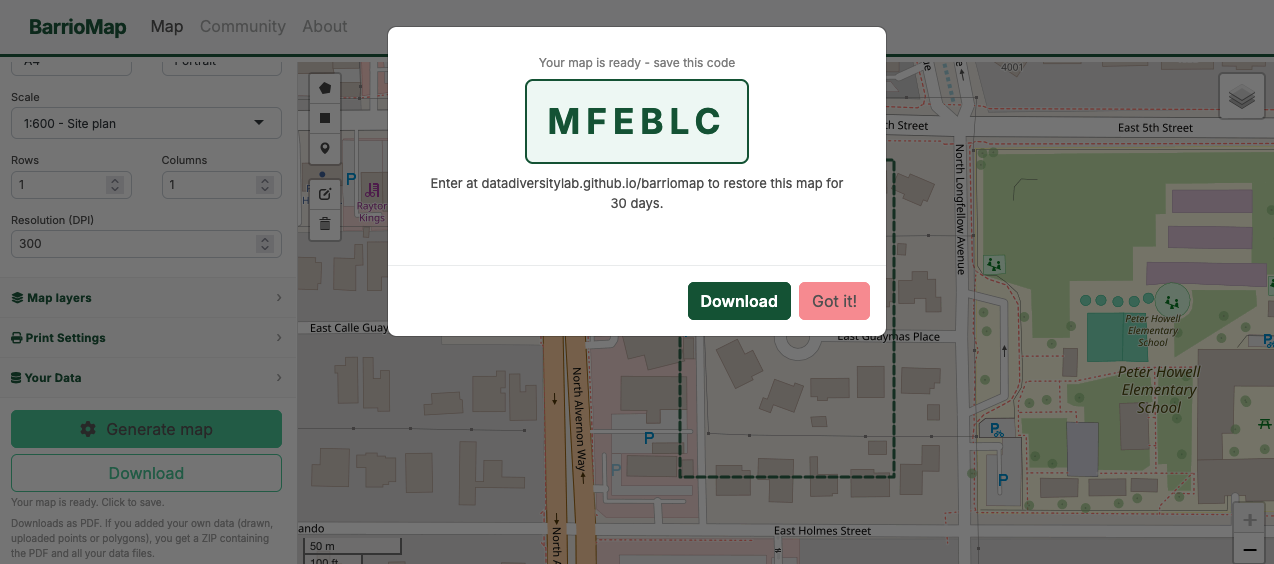
A popup also appears with a six-character code. This window includes your map code. Save it. You can enter it in the Map Code section any time in the next 30 days to restore your exact map, with all your settings and colors exactly as you left them. It is also printed on the cover page of your PDF.
What you end up with
A real map. Vector, not a screenshot. You can open it in Adobe Illustrator, Inkscape, or any PDF viewer. You can print it at any size without losing quality. You can bring it to a neighborhood meeting, tape it to a wall, mark it up with a pen, and photograph it to bring back into a digital workflow.
It is a map that looks like it came from a planning office!
Tips
Why is it slow the first time? The app downloads OpenStreetMap data for your region. For something the size of Arizona, that file is several hundred megabytes. After the first export, the data is cached and subsequent exports are much faster.
Can I share my map with someone? Yes, just give them your map code. If you checked "Share to community gallery" before generating, your map also appears on the Community page for others to find.
Does it work on my phone? Yes. The interface is responsive. Generating a PDF from a phone is a little slow but it works...
Is the data accurate? The map comes from OpenStreetMap, which is maintained by a global community of contributors. In most cities it is very accurate. In some rural areas it may be (very) incomplete.
BarrioMap is free. The code is open source at github.com/datadiversitylab/BarrioMap. I do not store any of your data. If something does not work, or if you have an idea for something that would make it more useful, open an issue or reach out!